Safety disclaimer
The Go Ride Weather Calculator (goRIDEwx) is informational only. It is for personal use only, not commercial use. You are solely responsible for your decisions and your safety. Conditions can change quickly and may differ from forecasts or on-screen indicators. A Green+ icon is not a guarantee of safe or comfortable conditions.
- Know your personal limits, health status, skills, and equipment.
- Use multiple sources (official forecasts/alerts) and local observation.
- If conditions look or feel unsafe, don’t go — regardless of what the page shows.
By using goRIDEwx, you agree that all actions you take are your own responsibility and that the authors and hosts of this site are not liable for any outcomes, injuries, or losses arising from its use.
About goRIDEwx
"goRIDE Weather Calculator"
Most weather apps show you forecasts and leave the decision to you. goRIDEwx starts with your limits for FEELS LIKE temperature, wind, precipitation and weather conditions then calculates if the conditions meet your definition of “go.” The result is your answer. Plan your riding day or week at a glance.
Sample 7-Day Dashboard
- Green + : goRIDE!
- Yellow - : goRIDE with caution - approaching your limits
- Red x : no-go, exceeds one or more of your limits
Alternatively Consider:
- Green + : Your Comfort Zone
- Yellow - : Your Uncomfortable Zone
- Red x : Your Discomfort\Challenge Zone (or ride Indoors)
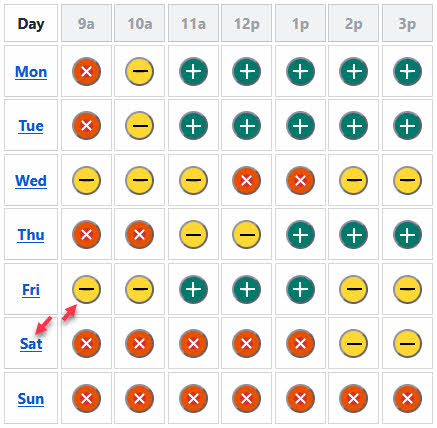
You've got your answer, now goRIDE!
- If you want the weather details, they are there:
- For Hourly Data, click the goDOT
- For the daily goTIME report, click the day (Fri, Sat, Sun...)
Explore all the system features in the topics below.
Weather Details
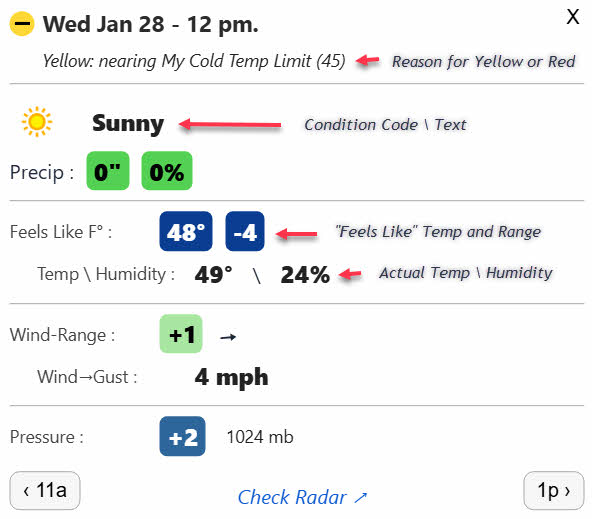
Hourly goDOT
- Clicking any of the goDOTs opens up the details for that hour
- Use this panel at the start of a ride to get locked into your ride plan
- Couple of features to note on this panel:
- Line 2 explains the 'why' for Yellow or Red goDOT
- "Check Radar" will open a new browser window zoomed into the Location
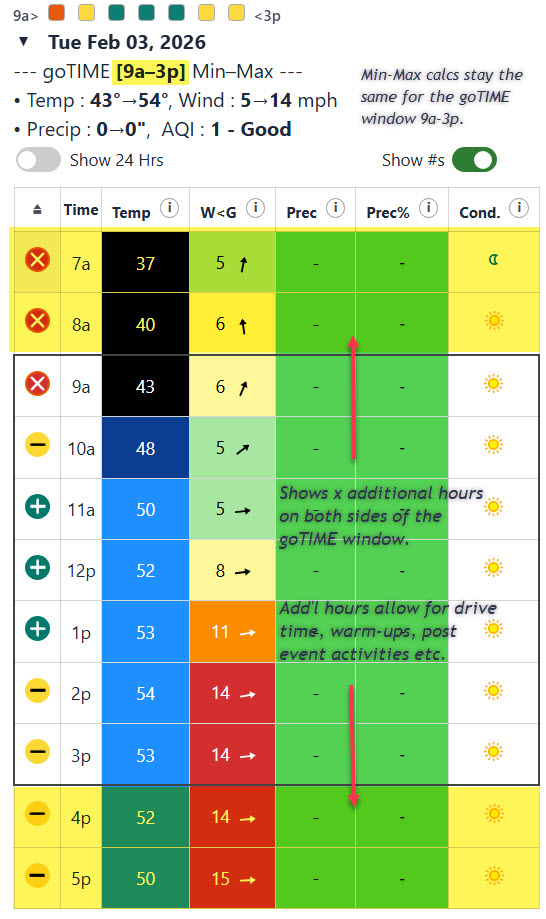
goTIME Daily Report
- Lightbar mimics the goDOT color pattern for the hours
- Clicking the 'Up Arrow' icon in the table header jumps back up to the Dashboard
- Clicking the 'Info' button in the table header opens more details about that factor
- Check Radar opens a new browser window to the location
- "Show 24hrs" toggle button will show all the hours for the day
- To permanently show additional hours go to "My Settings" -> "My Dashboard" -> "Show More Hours"
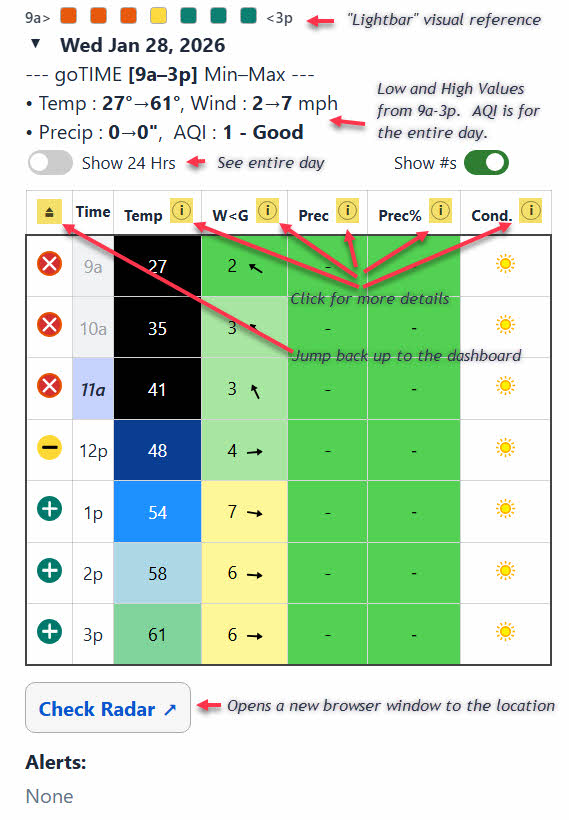
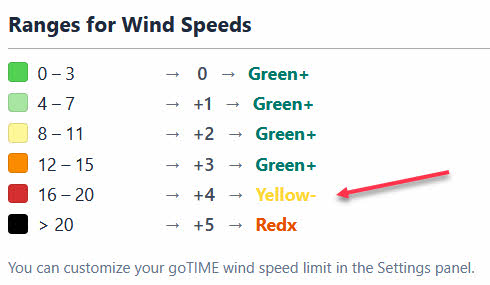
Example: clicking the Wind Info button shows the related Ranges, color-coding, icons and goDOT assignments.
The Yellow Dot
Explaining "Yellow -"
Yellow is still a goRIDE scenario but with caveats. It usually flags one or more of:
- Temp a bit cool/cold or warm/hot (never ride beyond your capabilities)
- Wind a little punchy (expect gusts)
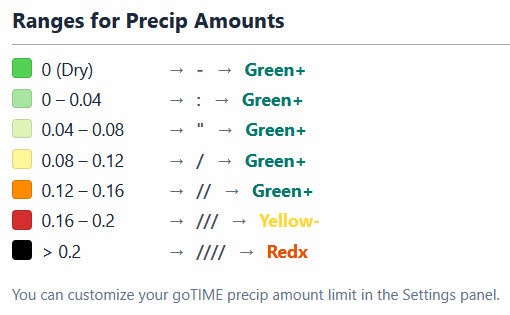
- Precip possible (damp/wet surfaces)
- AQI = 3 (sensitive people could be affected)
- Other Condition Codes (fog, light rain, light snow). Click the condition code Info icon for the full list.
Plan and prepare accordingly - then enjoy the ride.
An example with Wind Limit set to 20 mph, the Yellow goDOT kicks in at 16
goDot Logic Flow Diagram
If you really want to know the details of how the calculator checks for Red, Yellow, Green goDOTs then this panel is for you :-)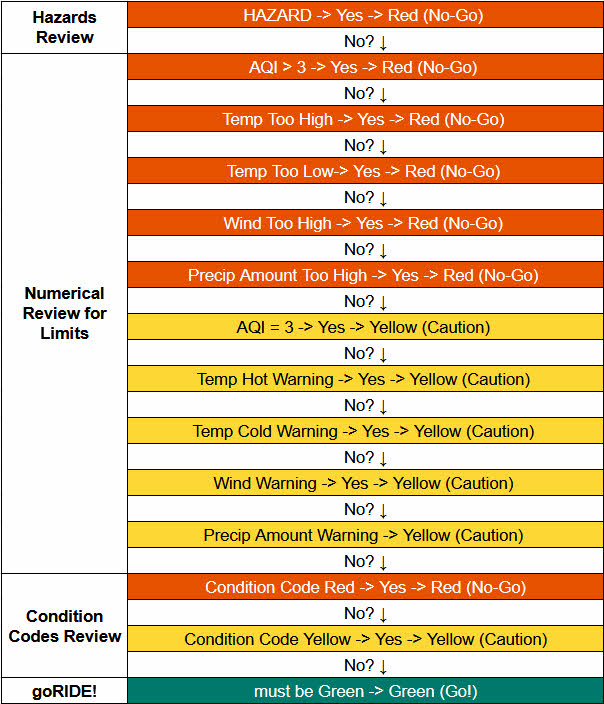
Location Names
Entering a location
- While the WeatherAPI is pretty flexible in accepting ZIP/postal code or City, ST.
- Common city names can resolve incorrectly : "Springfield"
- When in doubt, spell it out - Springfield IL
- or use the ZIP Code 62701.
- Worst Case Example, even spelled out, La Jolla CA will incorrectly return La Jolla MX
- Use ZIP CODE 92037
- Otherwise La Jolla California USA
Here's how it flows
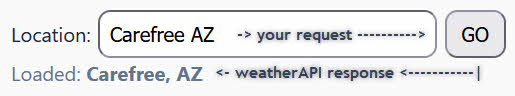
- Once the location is dialed in you are good to go
- On your mobile device your ZIP CODE will pop up automatically
- On mobile, speech to text works also
My Settings
My Settings -> My Limits
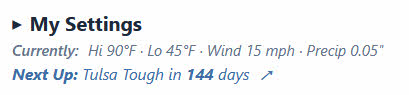
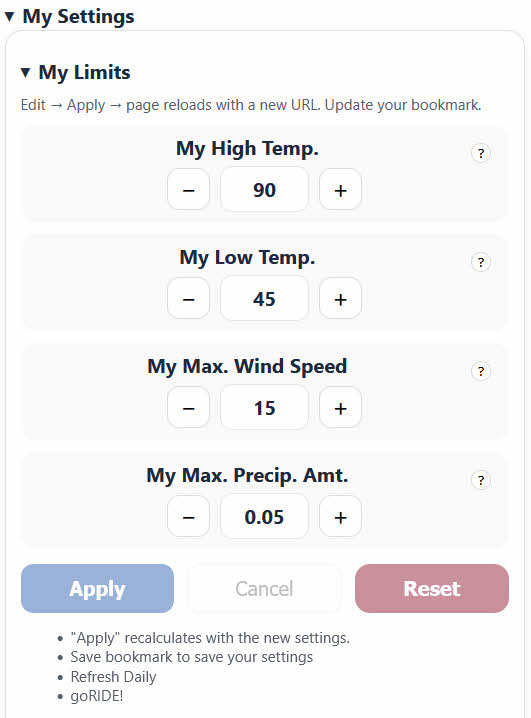
My Limits
My Limits Settings
Out of the box these are the default limit settings:- Hi Temp : 90F
- Lo Temp : 45F
- Wind : 15 mph
- Precip : 0.05" hr
- Set your limits, click Apply and the page will refresh and recalculate with the new settings.
- All your settings are saved in the new URL.
- Save it as a bookmark and you are good to go from here on out.
My Settings -> My Goals
My Goals
If you have a special event you are training for and want to keep the date in front you go to "My Settings" > "My Goals"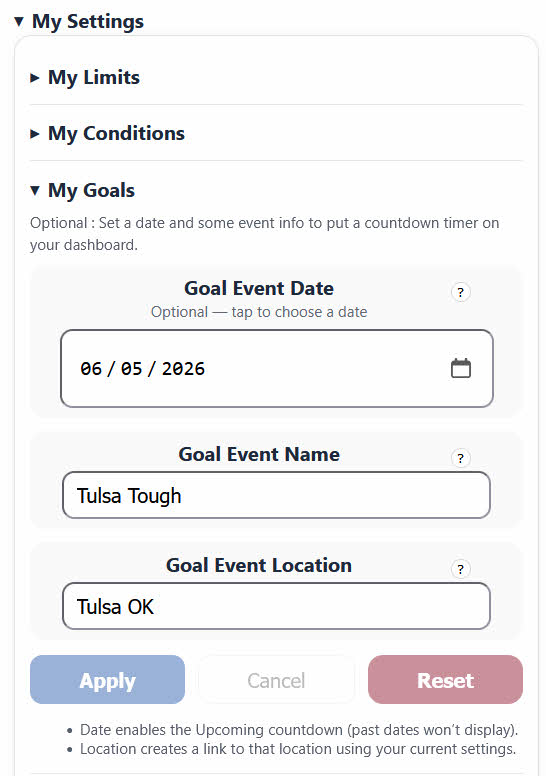
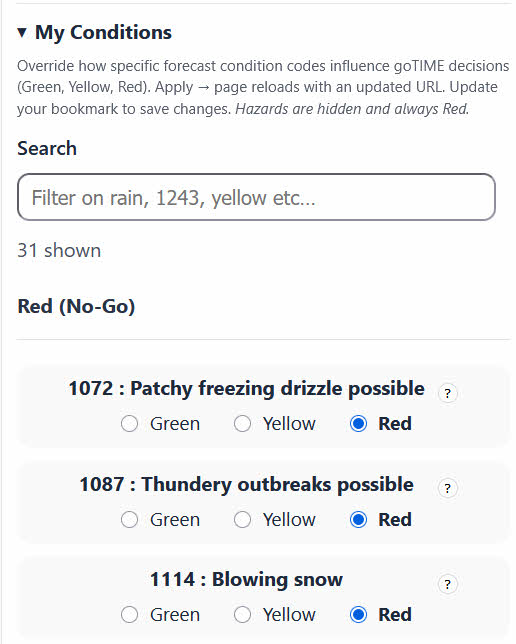
My Settings -> My Conditions
- WeatherAPI returns 48 different condition codes
- goRIDEwx puts them in two categories
- Non-Hazardous which you can modify
- Hazardous which are locked from changes
- Tip: Click the Info button to view all the Condition Codes

Non-Hazardous
- The WeatherAPI also returns a condition code (Sunny, Rain, Blizzard) for each hour.
- Each Condition Code is assigned a default goDOT color (Green, Yellow, Red)
- Non-Hazardous condition codes can be overridden in "My Settings" -> "My Conditions"
Hazardous
- The following condition codes are flagged internally as hazardous and their goDOT default is Red x and cannot be changed, at this time
- We are considering adding an Advanced Settings tab where you could override them but for now they are locked
- If you have a case that something should be unlocked send an email and we'll look at it
- Non-Hazardous condition codes can be overridden in "My Settings" -> "My Conditions"
- 1117 : Blizzard
- 1147 : Freezing fog
- 1168 : Freezing drizzle
- 1171 : Heavy freezing drizzle
- 1198 : Light freezing rain
- 1201 : Moderate or heavy freezing rain
- 1204 : Light sleet
- 1207 : Moderate or heavy sleet
- 1237 : Ice pellets
- 1249 : Light sleet showers
- 1252 : Moderate or heavy sleet showers
- 1261 : Light showers of ice pellets
- 1264 : Moderate or heavy showers of ice pellets
- 1273 : Patchy light rain with thunder
- 1276 : Moderate or heavy rain with thunder
- 1279 : Patchy light snow with thunder
- 1282 : Moderate or heavy snow with thunder
- Conditions that cause a Yellow or Red goDOT will have a border around the icon.

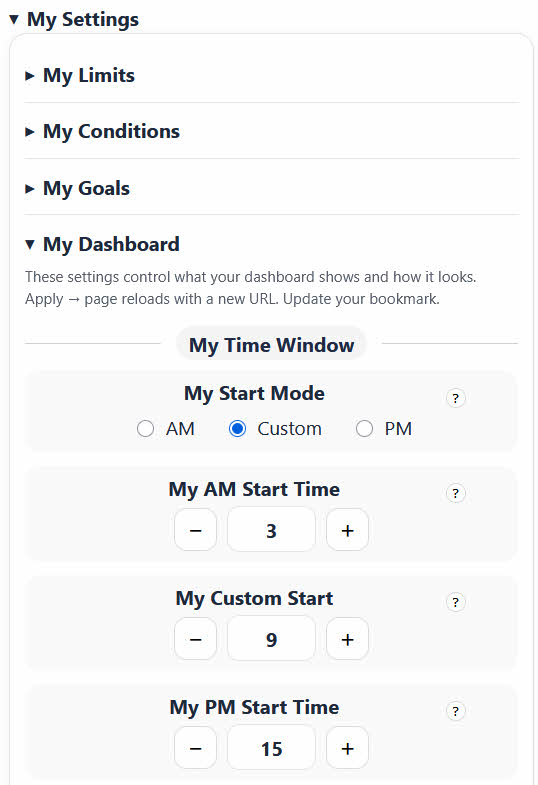
My Settings -> My Dashboard
- My Dashboard is a collection of settings that affect how the screens are presented
- My Time Windows
- My Layouts
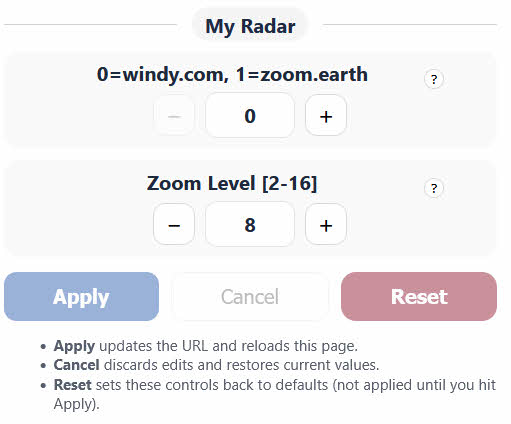
- My Radar
- See the on-line help (?) for additional info
- Be sure to scroll to the bottom to "Apply" any changes
- Then Update\Save your bookmark with the new setup
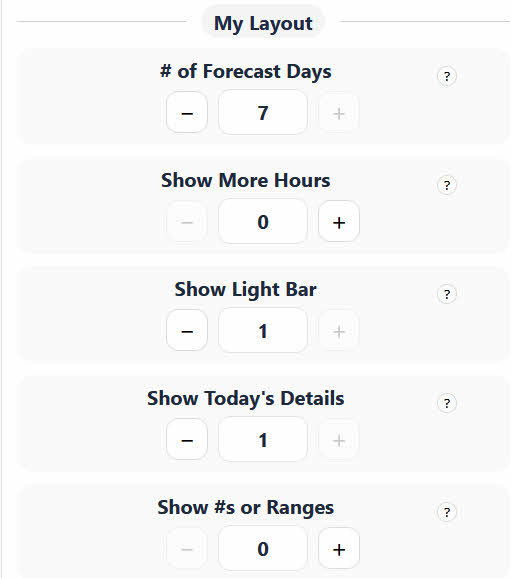
My Dashboard - Show More Hours
- A picture is worth a thousand words
- With Show More Hours = 2
My Dashboard - Show Numbers or Ranges
- A picture is worth a thousand words
- The default is to Show # which everyone can relate to
- The Show #'s toggle button on the Daily Report is a temporary switch to Show Ranges so you can see the Ranges in action
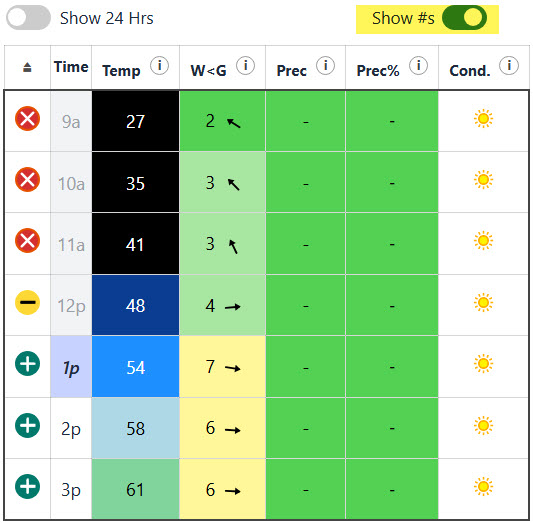
- Ranges are another way to hide the weather details
- Do you care if it's 61 or 64 degrees? They are both in the same range
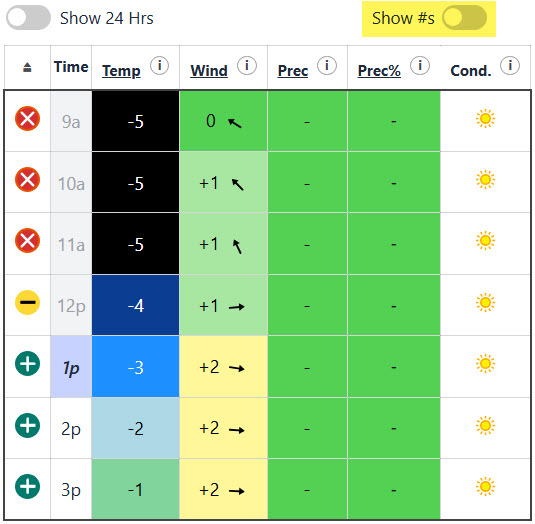
- Range 0 is your ideal comfort zone
- Ranges 1, 2, 3 move further away from ideal
- For Temp -1, -2, -3, -4 are getting colder while the + side is getting warmer
- Range 4 turns the goDOT yellow as you approach your limit
- Range 5 turns the goDOT red as you hit your limit
- With that concept then you really only need to care about what range you are working in
- The color-coding scheme remains the same for both Show Numbers and Show Ranges
- Also Ranges may work better for Metric users until we get those numbers in the system
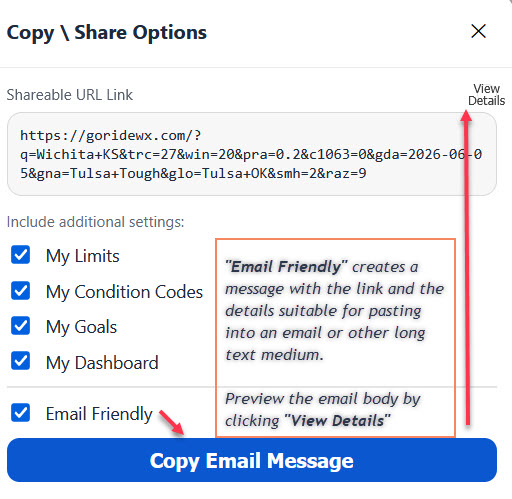
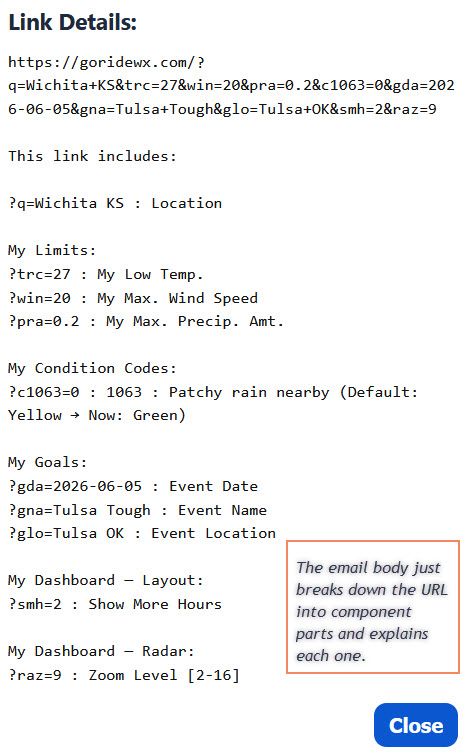
Copy-Share Link
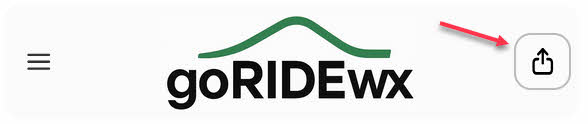
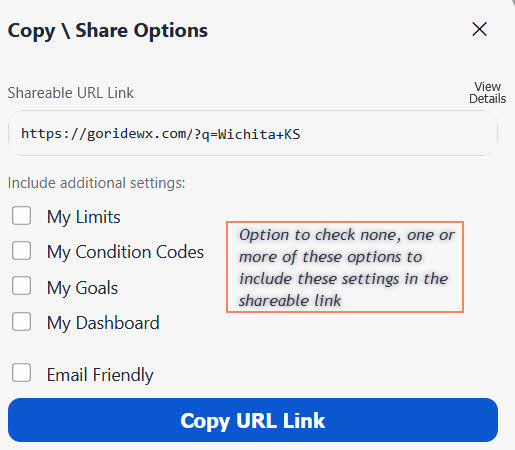
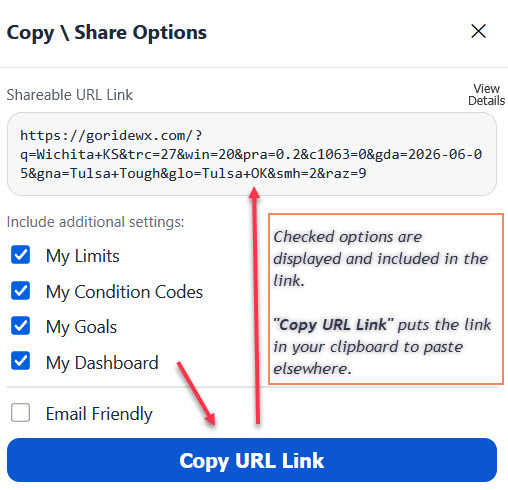
Copy-Share your Custom URL Link
- Need to copy or share your goRIDEwx URL then this panel is for you.
- The following screenshots will walk you through the setup options.
Presets
Pre-configured Dashboards
- Pre-configured regional dashboards are available on the Presets page
- Experiment with how well a SoCal preset plays in New England (and vice-versa)
- Find a preset that you like and use it or tweak further

What's Next
Some thoughts for future enhancements
- A split screen dashboard for commuters to show both their AM and PM hours in the goTIME window
- Metric Values!
- Maybe read a well organized calendar .ics file to auto load the 'Next Goal' ride and countdown timer.
goRIDEwx Background Story
- Retired IT guy and bike rider wanting to experiment with AI and build something useful
- Thought a bike riding weather dashboard would be a nice little project
- Through some creativity on my part and AI's technical work goRIDEwx was born
- Now goRIDE!
- The goal wasn't to create the perfect weather dashboard
- The goal was to learn the pros and cons of using AI to augment technical programming work
- Mission Accomplished and a side benefit is we have a tool to help decide when to goRIDE!
- Email: goridewx@tutamail.com
- Blog: nope - goRIDE
- Tweet: none - goRIDE
- Social: nada - goRIDE
- Podcast: null - goRIDE
- Micro.Blog: yes actually - here - goRIDE

Privacy Policy
goRIDEwx Privacy Policy
- goRIDEwx does not use cookies, tracking pixels, or analytics.
- goRIDEwx does use temporary, browser-local storage (such as session-based memory) to preserve on-page state and navigation continuity during a visit. This information is not transmitted to goRIDEwx servers, is not used for tracking, and is cleared automatically when the browser session ends.
- We do not collect, store, or sell personal information.
- Weather data is retrieved anonymously a third-party API (weatherapi.com) and processed in real time to generate on-screen results.
- goRIDEwx includes optional outbound links to third-party services such as Windy.com and Zoom.Earth. These external sites operate independently and have their own privacy policies and data-handling practices.
- goRIDEwx is not responsible for the content or privacy practices of third-party websites.
- Standard web server logs (e.g., IP address, request time) may be temporarily recorded by the hosting provider for security and operational purposes.
Last updated: Jan 15, 2026
goRIDEwx Terms of Use
- goRIDEwx is provided for personal, non-commercial use only as an informational and decision-support tool. It does not provide guarantees, warranties, or professional advice of any kind.
- Commercial use of goRIDEwx, including use in paid services, products, applications, or redistributions, is not permitted without prior written permission.
- Weather conditions are inherently variable and forecasts may be inaccurate or incomplete. Users are responsible for their own decisions and actions, including whether and how to ride, travel, or participate in outdoor activities.
- goRIDEwx uses third-party weather data sources and presents calculated results based on user-defined or default limits. These results are estimates and should not be relied upon as the sole basis for safety-critical decisions.
- goRIDEwx includes optional links to third-party websites such as Windy.com and Zoom.Earth. These sites operate independently, and goRIDEwx is not responsible for their content, availability, or practices.
- Use of this site is at your own risk. goRIDEwx and its operators shall not be held liable for any loss, injury, damage, or inconvenience resulting from the use of this site or reliance on its information.
By using goRIDEwx, you agree to these terms.
Last updated: Jan 15, 2026